Finding the Gold.
What your Meta performance report can reveal.
By Deborah Arpino
At first glance, this report looks like a collection of charts and tables.
It isn't.
Every section answers a different question, and together they build the story behind performance.
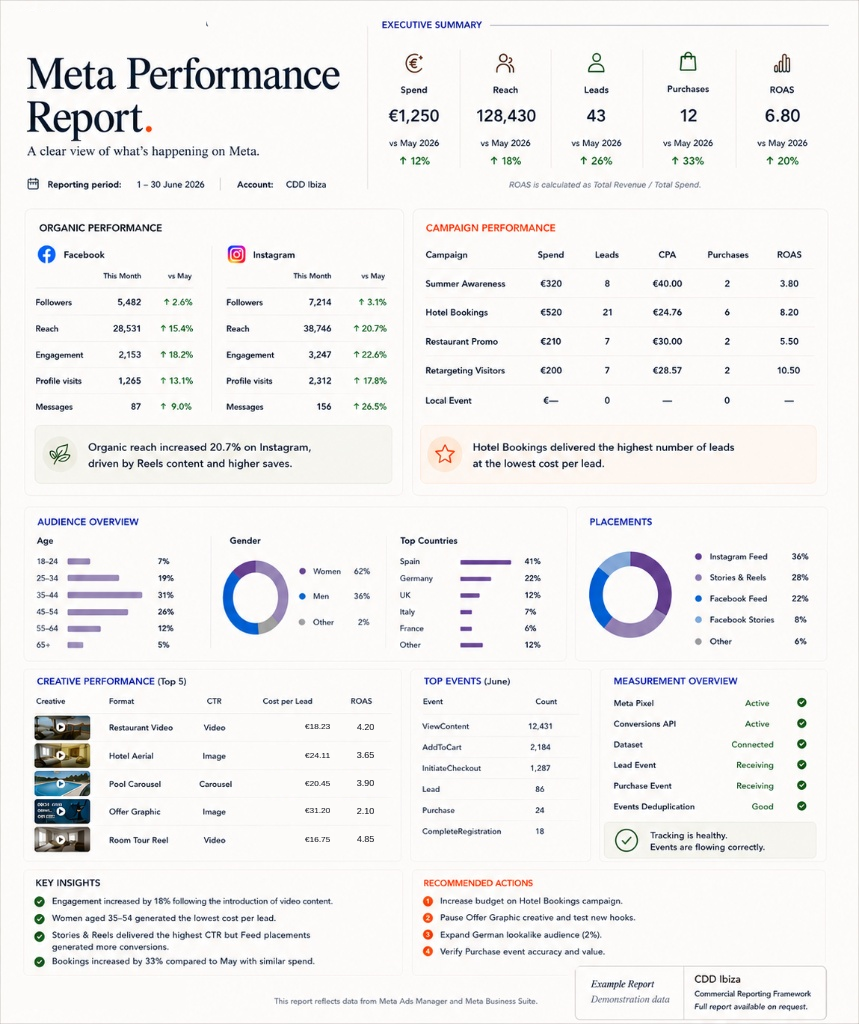
The Executive Summary
The Executive Summary at the top tells us that advertising generated a ROAS of 6.8, with 43 leads and 12 purchases from €1,250 of spend. Those are the outcomes. The rest of the report explains where they came from.
Organic Performance
The Organic Performance section shows that both Facebook and Instagram grew during the month. Reach, engagement and profile visits all increased, suggesting content was being seen and interacted with more often than in the previous reporting period.
Campaign Performance
Campaign Performance then shifts from organic activity to paid advertising. Not every campaign performed equally. In this example, Hotel Bookings delivered the strongest commercial result, producing the highest number of purchases with the lowest cost per lead. That's exactly the kind of insight that helps decide where next month's budget should go.
Audience Overview
The Audience Overview tells us who responded. Here we can see that women aged 35–54 formed the largest audience, with Spain and Germany contributing the highest share of users. Whether that's good or bad depends entirely on who the business is trying to reach, but it immediately tells us whether the campaigns are attracting the intended audience.
Creative Performance
Creative Performance answers another important question: which adverts actually worked? Rather than assuming one design or video is successful, the report compares creatives using commercial measures such as cost per lead and ROAS, making it easier to decide what should be repeated and what should be retired.
Measurement Overview
Near the bottom of the report, the Measurement Overview is easy to overlook, but it's one of the most important sections. Pixel, Conversions API and event tracking are all active, giving confidence that the results shown above are being measured correctly. Without reliable measurement, even the best-looking numbers become questionable.
Recommendations
Finally, the report finishes where it should: with recommendations. Reporting isn't about producing attractive dashboards. It's about deciding what to do next.