Encontrar el oro.
Lo que puede revelar tu informe de rendimiento de Meta.
Por Deborah Arpino
A primera vista, este informe parece una colección de gráficos y tablas.
No lo es.
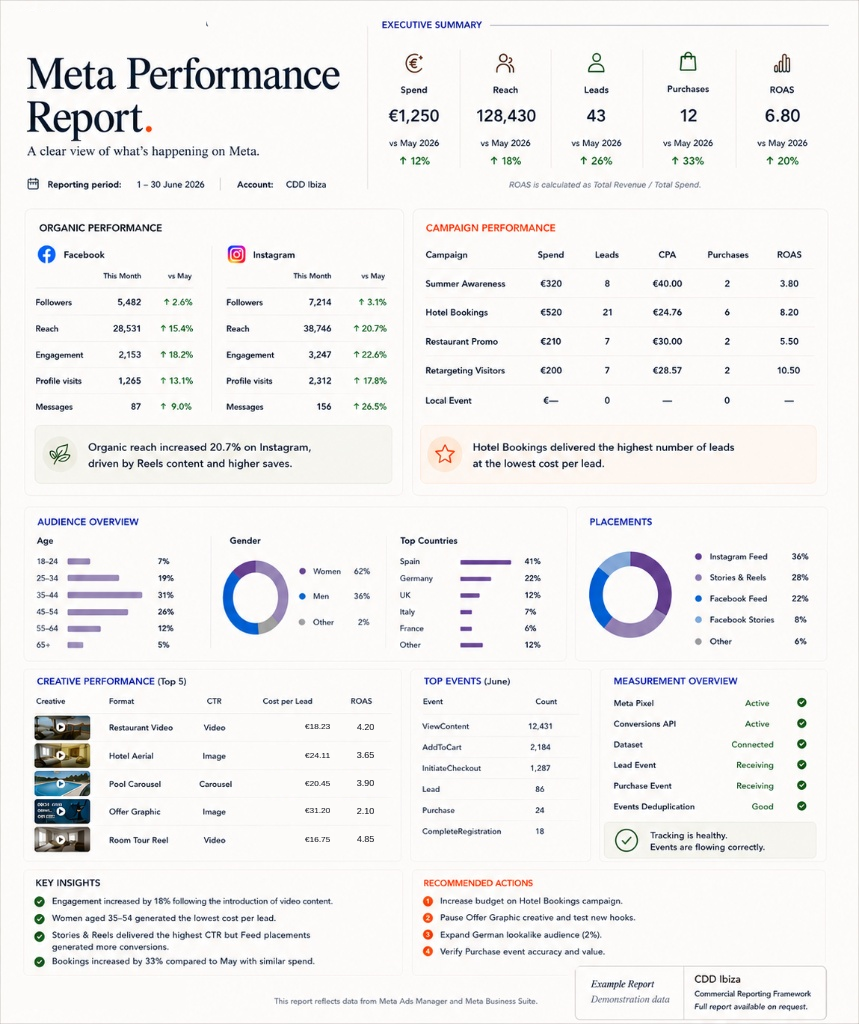
Cada sección responde a una pregunta distinta y, juntas, construyen el relato que hay detrás del rendimiento.
El resumen ejecutivo
El resumen ejecutivo de la parte superior nos dice que la publicidad generó un ROAS de 6,8, con 43 contactos potenciales y 12 compras a partir de una inversión de 1.250 €. Esos son los resultados. El resto del informe explica de dónde proceden.
Rendimiento orgánico
La sección de rendimiento orgánico muestra que tanto Facebook como Instagram crecieron durante el mes. El alcance, las interacciones y las visitas al perfil aumentaron, lo que sugiere que el contenido se veía y recibía interacciones con más frecuencia que en el periodo anterior del informe.
Rendimiento de las campañas
La sección de rendimiento de las campañas pasa de la actividad orgánica a la publicidad de pago. No todas las campañas rindieron igual. En este ejemplo, Reservas de hotel obtuvo el mejor resultado para el negocio, con el mayor número de compras y el menor coste por contacto potencial. Este es precisamente el tipo de información que ayuda a decidir a dónde destinar el presupuesto del mes siguiente.
Visión general de la audiencia
La visión general de la audiencia nos dice quién respondió. Aquí vemos que las mujeres de entre 35 y 54 años constituían el grupo más numeroso, y que España y Alemania aportaban la mayor proporción de usuarios. Que eso sea bueno o malo depende por completo de a quién quiera llegar el negocio, pero nos indica de inmediato si las campañas están atrayendo a la audiencia prevista.
Rendimiento de las creatividades
El rendimiento de las creatividades responde a otra pregunta importante: ¿qué anuncios funcionaron realmente? En lugar de dar por hecho que un diseño o un vídeo tiene éxito, el informe compara las creatividades mediante métricas de negocio como el coste por contacto potencial y el ROAS, lo que facilita decidir qué conviene repetir y qué conviene retirar.
Visión general de la medición
Cerca del final del informe, la visión general de la medición puede pasar desapercibida, pero es una de las secciones más importantes. El Píxel, la API de conversiones y el seguimiento de eventos están activos, lo que da confianza en que los resultados mostrados más arriba se están midiendo correctamente. Sin una medición fiable, incluso las cifras más prometedoras resultan cuestionables.
Recomendaciones
Por último, el informe termina donde debe: con recomendaciones. Elaborar informes no consiste en producir cuadros de mando atractivos. Consiste en decidir qué hacer a continuación.